O.k, I'm taking a break from finishing altimeters and my regular job to bring you data from John Wilke's K record shot.
First, a note on the altitude. Parrot #118 was along for the ride, and it has had a rough life. It has survived a fireball from a charge that blew past a bulkhead and covered it in soot, and a lawn dart from 1100 feet. So I wasn't all that confident in this particular altimeter when it read a few hundred feet higher than John's Alt45k. But after the launch, I took it home and re-tested it in my chamber, and it was reading 1.00048 times the pressure delta that my NIST-referenced calibration gauge did. That's 0.05% pressure error, or the equivalent of 11 feet at 23kft altitude. I'm completely confident that John's rocket went to 25724 feet AGL based on the traditional standard atmosphere method. And based on data from the 6AM denver weather balloon, the true altitude was 26168.
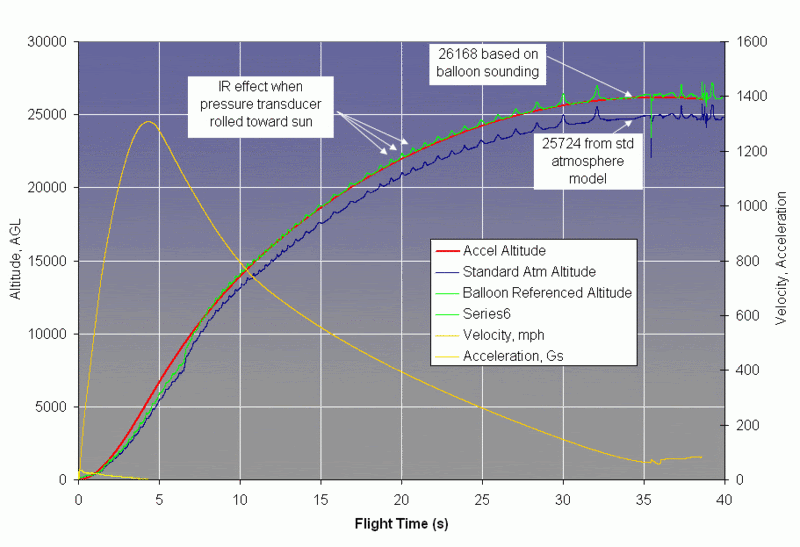
The little bumps in the altitude are expected for a setup like John's in which the altimeter's enclosure is not opaque to infra-red from the sun. When the sensor faces the sun, there's an upward bump in the altitude reading from the sun shining into the sensor. You can count the number of rolls during the flight.
Here's some more data: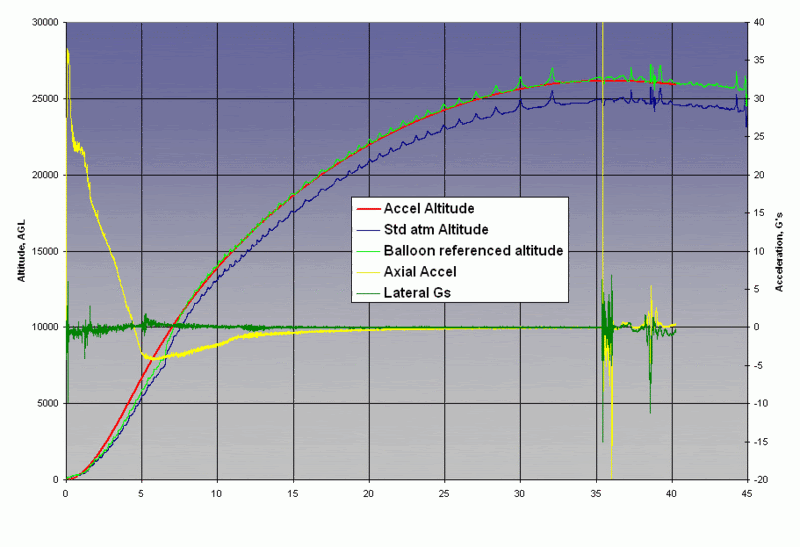

The thrust curve, below, is calculated by subtracting off the calculated aero dynamic drag that comes from the Cd vs. velocity curve above. This data is preliminary based on some approximate masses and diameter.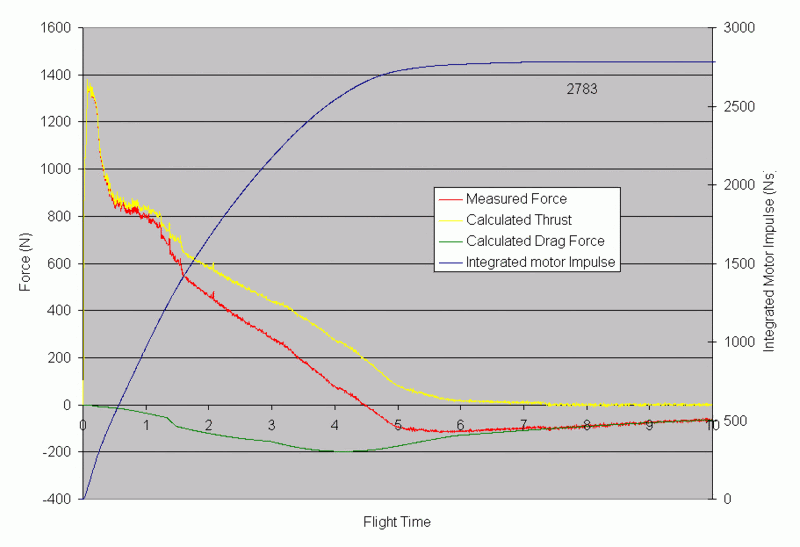
Adrian, I'm curious why the velocity never got to ~0mph. I understand if there is a parabolic trajectory it may not ever stop completely, but as you saw it was a *very* straight boost... I'd have thought it nearly did a tail-stand up top. Hence at some point, velocity should be essentially zero.
Also, per my email to you earlier in the week, I cannot say for sure that the Parrot was mounted precisely vertical due to the way my (very tight) ebay was laid out. If the altimeter was not vertical, the baro stuff would be fine, but anything accelerometer-based would be off a bit. Any thoughts there? How much of the data presented is baro-based and how much accelerometer-based?
Very interesting...
I put in a small (2 or 5, I don't remember which) degree initial flight angle, mostly because there was some measured drag acceleration at apogee. You can see from the Cd plot that the assumed Cd shoots way up over 1 at low velocity, which says to me that the velocity at apogee that the post-processing came up with is probably a bit low. The accel has a non-zero offset and potentially a small scale factor error that I compensate for in the post-processing. I adjust those so that the accel is reading 1 G on the pad before liftoff, the Cd curve and initial flight angle are reasonable, and the altitude curve matches with the baro curve.
The blue and green altitude lines are purely baro-based, and the red line comes from propagating the accelerations. The Cd and thrust lines are all based on the accel data.
OK, more questions from a non-engineer 😯 the blue line seems to be essentially peaking at just below 25K, with some bigger spikes. The 25,724' would seem to be such a spike. Isn't that an anomaly ("noise"?) and if you read the "smooth" curve, wouldn't that point to a reading of just under 25K? (not that an altitude pig like me is trying to give away altitude).
Also, the spikes would seem to indicate that the rocket was spinning quite a lot - several times per second. That did not appear to be the case during boost. Is it possible that spiking is coming from something else? I'd think that a 1000+mph boost wouldn't do well with several revolutions per second.
Interesting data. BTW, Rocksim predicted ~33.5 gees...
JW
OK, more questions from a non-engineer Shocked the blue line seems to be essentially peaking at just below 25K, with some bigger spikes. The 25,724' would seem to be such a spike. Isn't that an anomaly ("noise"?) and if you read the "smooth" curve, wouldn't that point to a reading of just under 25K? (not that an altitude pig like me is trying to give away altitude).
Aw crap, I have a typo on that graph label. I think it should be 24724. I don't have the data handy but I'll double check. Sorry about that.
Also, the spikes would seem to indicate that the rocket was spinning quite a lot - several times per second. That did not appear to be the case during boost. Is it possible that spiking is coming from something else? I'd think that a 1000+mph boost wouldn't do well with several revolutions per second.
It would be interesting to look at a video to try to tell if we can see the fins are moving. A roll rate of several revs per second doesn't seem very extreme to me. With the speed the rocket was moving, it would imply a tiny fraction of a degree of equivalent fin misalignment. A friend of mine flew a Parrot in an unpainted 18mm nosecone with a C6 motor, it recorded the "sun bumps" and when we analyzed the data afterwards we clocked it at over 50 revs/second in the fastest part of the flight. If the pulses were very regular I might consider the possibility that it was interference from the tracker, but the shape of the bumps, the way they speed up and slow down with the rocket, the higher intensity when the rocket leveled out, and the fact that we didn't do anything to prevent this known effect all lead me to believe that the bumps are from a view to sun during a roll spin.
By the way, I looked back at the data and confirmed that the AGL for John's flight was 24,724 feet, when calculated in the traditional way based on the standard atmosphere.
Latest Post: Hello World Our newest member: jungferreira Recent Posts Unread Posts
